


Exit prices and liquidity in tech buyouts
Exit prices and liquidity in European tech buyouts, 2021-2026
This note tracks exit prices for European tech companies under LBO and sets them against fund valuations. Three findings. The exit multiple, which fell as much as 28% below the entry multiple at end-2024, is only 6% below it by mid-2026, moving in step with monetary policy. Holdings acquired during the Covid period are reaching maturity without being sold: in our sample, 39 out of 45 are still in portfolio. A 15-25% gap persists between fund valuations and the prices buyers offer, on holdings that are not put up for sale.
1. Exit multiples and policy rates
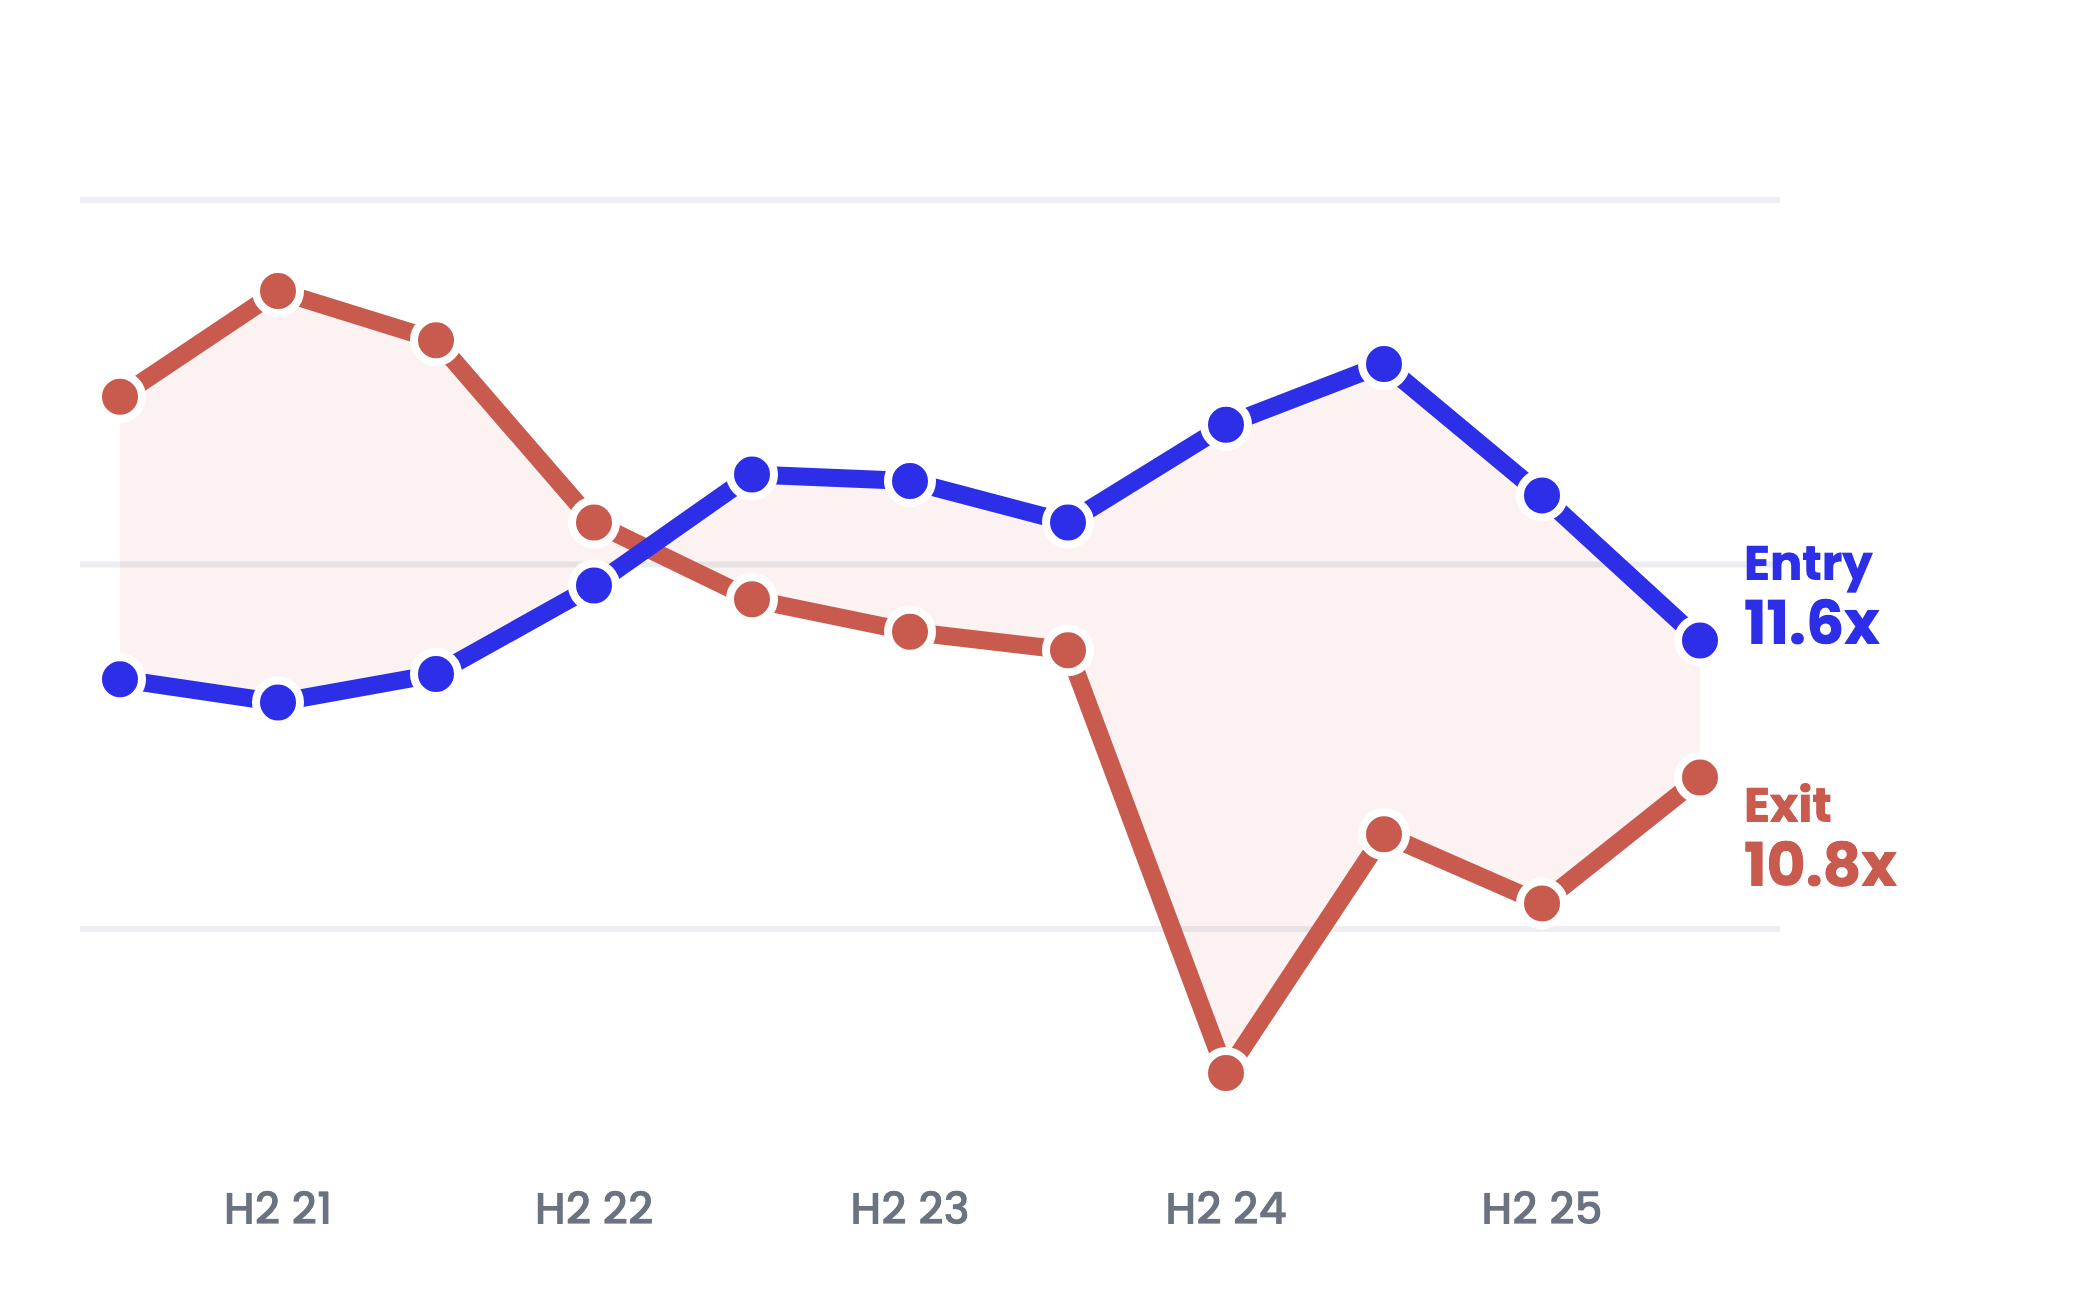
The price at which a tech company under LBO is sold has followed monetary policy, with a lag. The median exit multiple peaked at 13.6x in early 2022, when the ECB deposit rate was still at −0.5%. It slid to 11.6-12x as rates rose to 4%, then dropped in 2024 to reach 9.2x at year-end. The ECB began cutting in June 2024; the exit multiple recovered to 10.5x in mid-2025 and 10.8x in mid-2026, without returning to its 2021 level. Entry prices held up better: across all transactions, the median stays close to 12x over the whole period. It is the gap between the two that widened (section 2, chart 2).
This price only covers companies that were actually sold. The index no longer shows a discount because the holdings that would require one are not put up for sale. Our fund sample confirms it: the share of buyout holdings sold during the year fell from about 21% in 2020 to 7% in 2024.
2. Entry multiple and exit multiple
In 2021, a company under LBO sold 15 to 20% above the multiple paid at entry. The two curves cross in early 2023, after the ECB raised rates from −0.5% to 4% in fourteen months. The gap stays contained (−6 to −7%) until mid-2024, then the exit price drops: 28% below entry at end-2024, 20% in mid-2025. With the ECB back at 2%, the gap narrows: −18% at end-2025, −6% in mid-2026, at 10.8x for an entry at 11.6x. The convergence comes as much from the recovery in exits, from 9.2x to 10.8x, as from the fall in the entry multiple, from 13.1x to 11.6x.
A tech LBO completed in 2021 was paid a median 11.3x EBITDA (chart 2, end-2021). Sold today, it would fetch around 10.8x: the multiple no longer creates value, it takes a little away, and performance depends entirely on EBITDA growth (section 5). These holdings are past the 45-month median holding period and approaching five years, the point beyond which the median IRR on exits in our sample drops from 26-29% to 13%. Waiting for a better multiple lengthens the holding period and dilutes the IRR; in our sample, none of the 15 holdings from the 2021 vintage with a known multiple has been sold yet.
3. Prices by size and valuation of holdings
For holdings acquired in 2021-2022 and still in portfolio, the funds in our sample carry a median valuation of 9.5x EBITDA, 16% below the price paid for companies in the same sector and of the same size. On the small number of sales to other funds in the sample, the price paid is in the same range, about 14% below comparables. On the secondary market, a buyout fund stake trades at around 91% of NAV.
| Size (enterprise value) | H1-21 | H1-23 | H1-25 | H1-26 | Trend |
|---|---|---|---|---|---|
| Small · below €100M | |||||
| LBO entry | 10.0x | 10.5x | 11.3x | 10.4x | |
| Exit (sale by a fund) | 11.0x | 6.9x | 8.6x | 9.4x | |
| Exit / entry gap | +10% | −34% | −24% | −10% | |
| Mid and large · €100M and above | |||||
| LBO entry | 13.7x | 13.9x | 14.3x | 13.9x | |
| Exit (sale by a fund) | 15.9x | 13.7x | 11.9x | 11.2x | |
| Exit / entry gap | +16% | −1% | −16% | −19% | |
4. Acquirer profile and prices
Buyout liquidity relies first on other funds, the most price-sensitive buyers. Medians of successful exits of SMEs and mid-sized companies:
| Acquirer | Fund multiple | Median IRR | Holding period | Price vs NAV |
|---|---|---|---|---|
| Private equity funds | 2.0x | 20% | 45 months | 1.27x |
| Corporates | 2.0x | 27% | 51 months | 1.24x |
| Management, OBO, existing shareholder | 2.3x | 20% | 43 months | 1.22x |
| Refinancing (mezzanine) | 1.4x | 17% | 22 months | 1.16x |
5. EBITDA growth, holding period and IRR
EBITDA growth is by far the variable most closely linked to deal performance. Across 77 decomposed deals, value creation comes from EBITDA (+0.88x entry equity), far more than from the multiple (+0.10x). Debt often increased (−0.20x) to fund acquisitions or dividends.
Time also works against the seller: the median IRR on exits drops from 26-29% before 5 years of holding to 13% beyond. For a stagnating holding, waiting two years to avoid a 20% discount often means paying it anyway, with a diluted IRR on top.
6. Implications for portfolio management
This requires reconciling NAVs with observable market references (multiples by sector and size, prices paid by acquirer type) rather than with entry multiples, and pricing quickly from the same data. On that condition, direct sales and continuation vehicles will become a routine portfolio management tool.
Exit prices and liquidity in tech buyouts
−6%
Exit vs entry multiple in mid-2026, after −28% at end-2024
15-25%
Gap between buyer offers and the value funds carry

Discover our Solutions and Transform Data into Strategic Advantage


Ready for a demo ?
Get a demo