In this first release of the EuroTech Valuation Index (EVI), we publish a consistent benchmark of European tech valuation multiples, based on EV/Revenue observed across Venture Capital and Private Equity transactions in Greater Europe, using ScaleX Invest’s proprietary private-deal dataset.
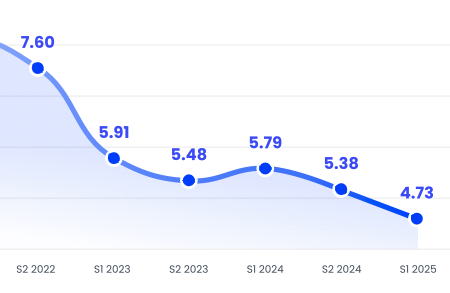
At end S1 2025, the EVI stands at 4.73× EV/Revenue, down 12% vs S2 2024 and well below the post-Covid peak of 8.24× in S1 2022. The story, however, is not simply “down”: pricing is reshaping across maturity profiles, sectors and geographies, while public markets are beginning to offer—selectively—credible exit routes again.
What is the EuroTech Valuation Index?
The EuroTech Valuation Index tracks revenue multiples (EV/Revenue) observed in European private tech transactions, spanning Venture Capital (early and late stage) and Private Equity (Growth Equity and Buyout). The objective is straightforward: to give investors, LPs and banks a repeatable, data-driven valuation reference that reflects how the market is actually pricing private assets.
Data coverage and methodology
The 2025 edition is built on 11,000+ valuation observations since 2020, focused on tech companies headquartered in Greater Europe, and on deals with post-money valuations above €1m. The current sample includes 11,261 observations, split across:
• Venture Capital: 6,259 (Early-stage 2,986; Late-stage 3,273)
• Private Equity: 5,002 (Growth Equity 1,289; Buyout 3,763)
This depth matters: it enables robust comparisons of European tech EV/Revenue multiples, suitable for valuation work and committee-level discussions.
S1 2025 snapshot: repricing is under way
The headline move is a mild softening in S1 2025. But multiples are not moving in lockstep: dispersion is widening across segments, particularly between Venture Capital by stage and Private Equity by strategy.
In practice, early-stage VC remains the key pocket of resilience, late-stage VC is still subdued, Growth Equity has rebounded, and Buyout multiples remain constrained by financing conditions.
Venture Capital: recent early-stage deals command a selectivity premium
In S1 2025, Venture Capital multiples eased slightly overall, but the early/late-stage gap is the clearest signal. The median VC multiple is 7.33× EV/Revenue, driven by an early-stage median of 10.29×, while late-stage VC sits at 4.72×.
This divergence is primarily a function of selection and scarcity. Many mid-quality rounds are no longer closing at targeted prices, which concentrates observed activity in higher-quality financings. In that context, the most convincing AI-advantaged assets continue to attract competitive processes and retain pricing power. Late stage, by contrast, remains capped by investor requirements around profitability and credible exit timing, which limits multiple expansion even when revenue growth stays solid.
Private Equity: Growth Equity is back in focus
On the Private Equity side, the index confirms a familiar cycle dynamic: as late-stage VC becomes harder to price, capital rotates toward Growth Equity, where cash generation is more visible.
At end S1 2025, the Private Equity median is 2.18× EV/Revenue. Within that aggregate, Growth Equity rebounds to 4.29×, while Buyout remains compressed at around 1.85×—still far below the S1 2021 peak of 3.51×.
Put simply, operational traction and cash generation remain the primary valuation drivers. Leveraged outcomes, however, face greater discipline as the cost and availability of leverage remain materially less favourable than in 2020–2021.
Sector multiples: AI stands apart as policy risk reshapes ClimateTech
Sector dispersion has become a defining feature of European tech pricing, and the EVI makes that immediately visible. AI remains the clear outlier, with a median multiple of 11.97× EV/Revenue, structurally above the rest of the market.
Behind AI, a second group sits in the mid-to-high single digits: E-health at 7.45×, CleanTech & Energy at 7.05×, and SaaS at 6.50×.
What matters is not just the ranking, but the drivers. AI continues to price a combination of perceived defensibility and upside. CleanTech & Energy, meanwhile, is increasingly sensitive to policy visibility and financing conditions, which are actively reshaping valuation ranges. SaaS and E-health are settling into a more selective regime where growth alone is not enough—revenue quality, retention and a credible path to profitability increasingly set the multiple.
Should we expect an IPO comeback?
This is one of the most important signals in this edition: in S1 2025, public tech EV/Revenue multiples move back above Private Equity for the first time since 2021. When public comparables become attractive relative to private marks, IPO trajectories can start to emerge. The question now is whether this shift persists—and which categories of assets will be first to benefit over the coming semesters.
What this means for investors
For GPs, LPs and banks, the S1 2025 edition points to four practical takeaways.
First, benchmarking needs to be maturity-aware: the relevant reference points are not the same in early-stage, late-stage, Growth Equity and Buyout, as these segments respond differently to the cost of capital, profitability expectations and liquidity constraints.
Second, dispersion is here to stay. Multiples are increasingly concentrated in assets with defensible fundamentals—robust growth, clear monetisation, strong revenue quality (retention, pricing power) and credible visibility on exit options.
Third, some sectors now need to be underwritten as “policy-sensitive” asset classes. In CleanTech/ClimateTech, valuation trajectories depend as much on regulatory stability, support mechanisms and financing conditions as they do on technology and execution.
Finally, public markets are becoming useful leading indicators again. Public repricing can reopen—or close—exit windows quickly, and deserves to be integrated more systematically into private valuation governance.
How ScaleX Invest helps you apply the EVI
The EuroTech Valuation Index is not just a publication—it is designed to plug into portfolio valuation workflows within the ScaleX Invest platform.
ScaleX Valuation: modelling that reflects instrument structure (equity, debt, convertibles), waterfall impact, and IPEV-aligned governance to produce audit-ready marks.
ScaleX Monitoring: near real-time NAV logic and cap table tracking to keep valuations consistent from one period to the next.
ScaleX Scoring: resilience and liquidity scoring built on a decade of backtesting, supporting risk-aware portfolio decisions.
Download the EuroTech Valuation Index
FAQ
What does the EVI measure exactly?
The EVI tracks median EV/Revenue multiples observed in European private tech transactions across Venture Capital and Private Equity.
Why focus on EV/Revenue multiples?
EV/Revenue remains one of the most widely used comparable tools in high-growth tech, particularly when profitability is not yet achieved or stabilised. Combined with stage and quality segmentation, it enables consistent benchmarking across the market.
How often will the index be updated?
This edition is a snapshot as of end S1 2025. The methodology is designed to be refreshed periodically to track repricing over time.
Can I use the EVI for audit and valuation governance?
Yes. The EVI is intended as a benchmark input into IPEV-aligned valuation processes to support consistent marks and documentation, without replacing deal-specific fundamental analysis.