Private equity and venture capital funds face constant pressure to deliver reliable reporting and accurate valuations within tighter deadlines. Data is often scattered across different tools and requires multiple reconciliations before it can be presented to LPs or investment committees. Manual exports create delays and inconsistencies, turning reporting into a recurring pain point for CFOs and asset managers.
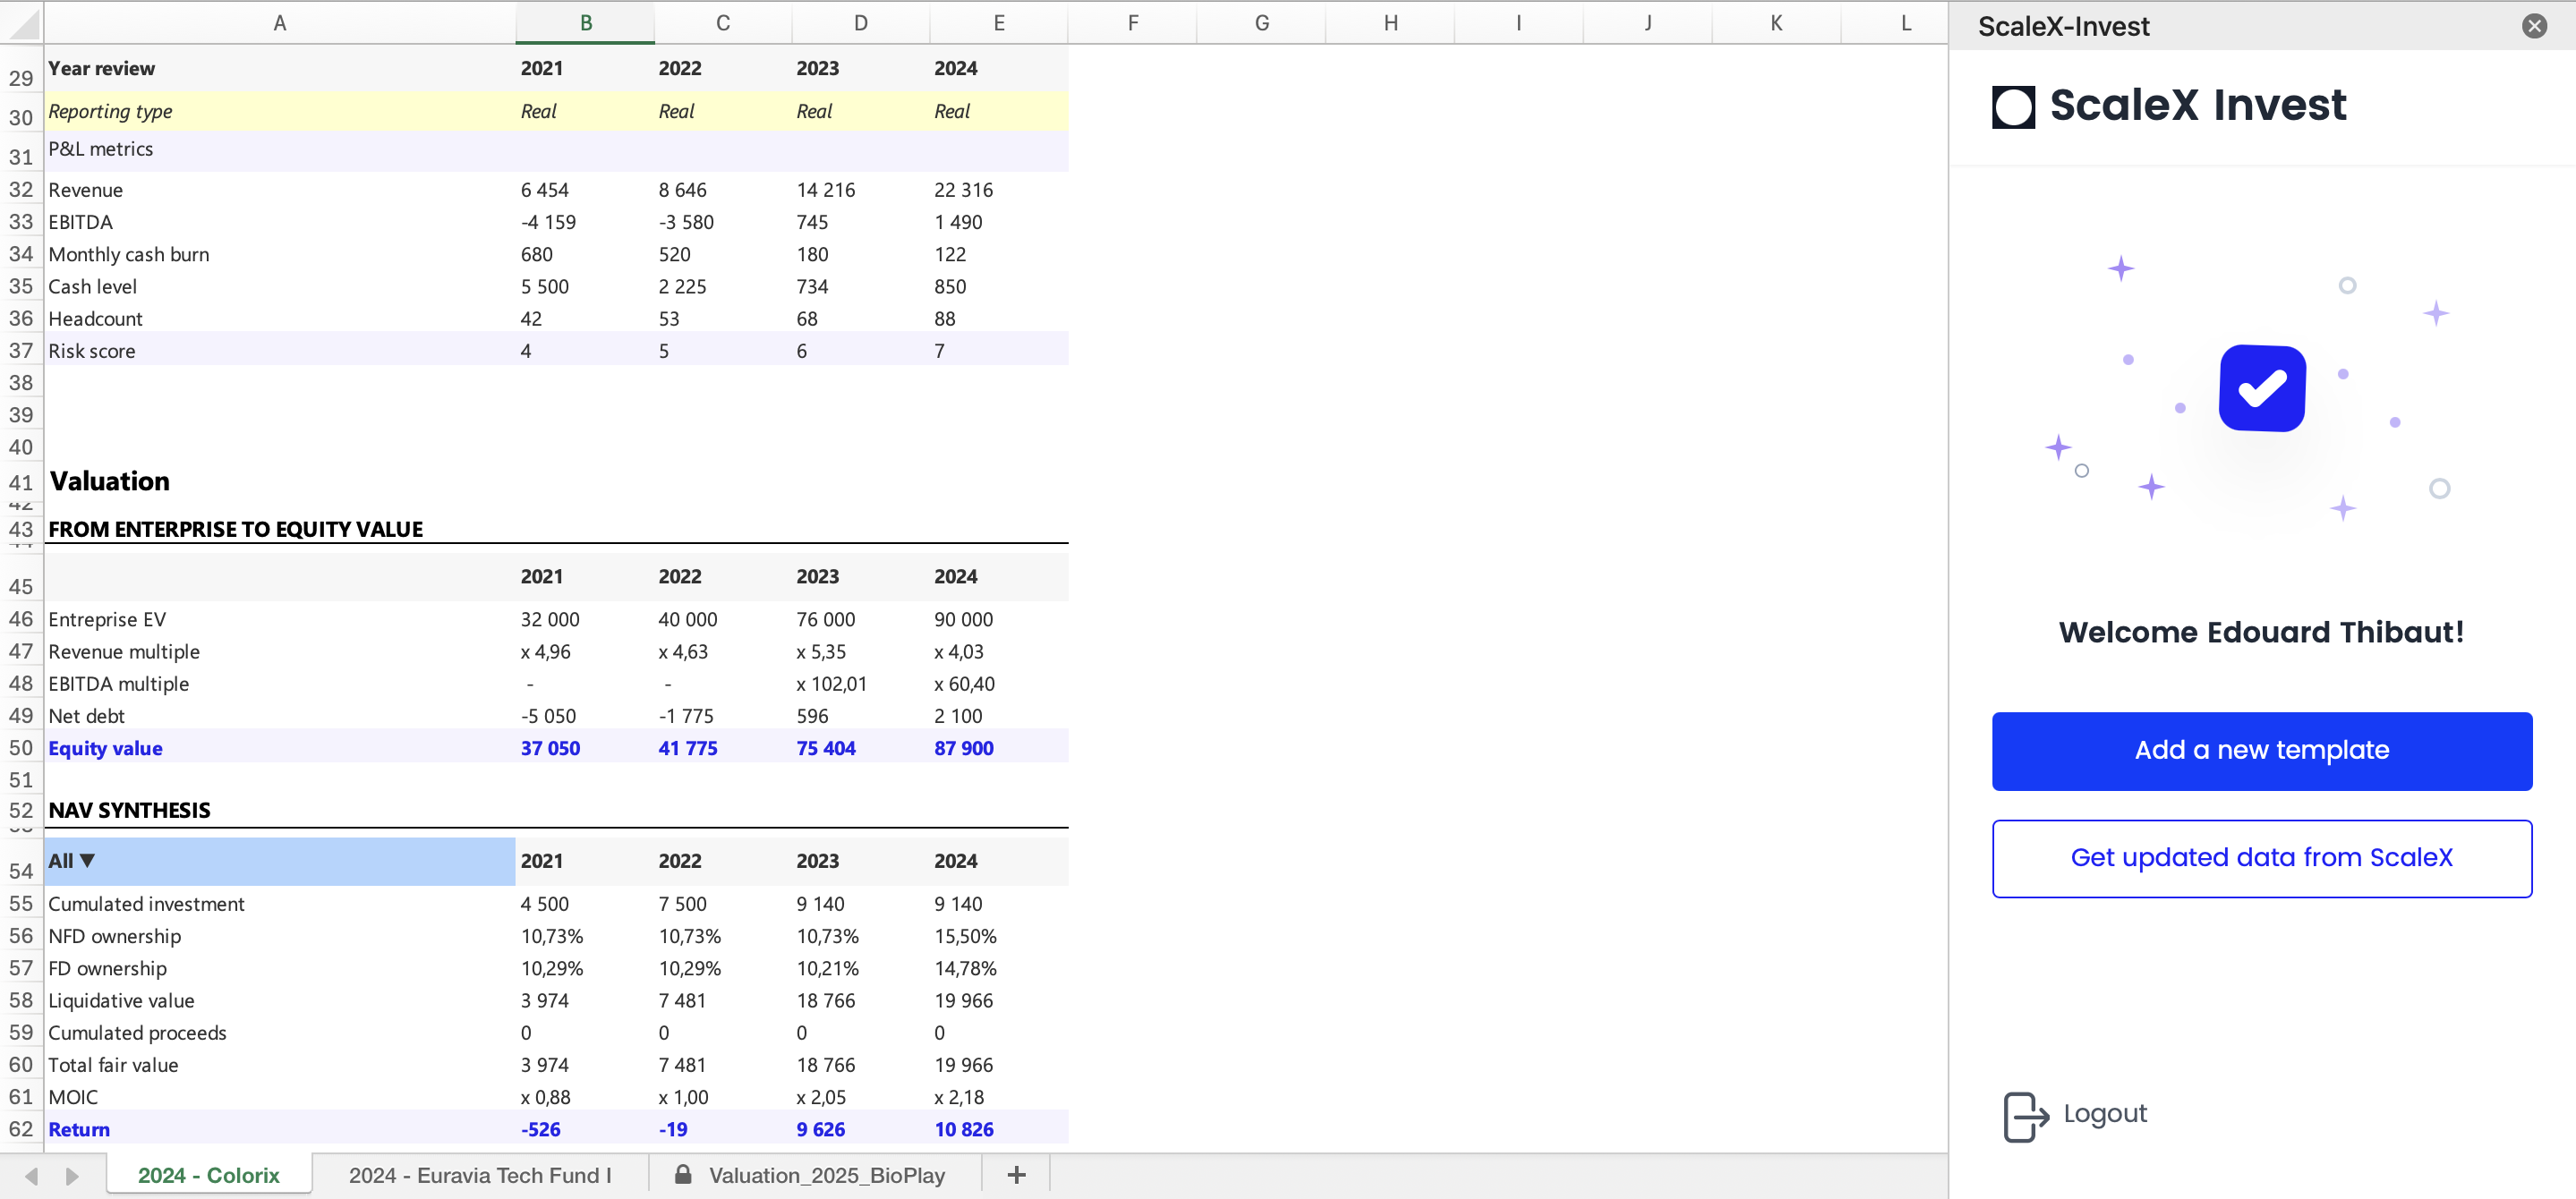
ScaleX Invest now addresses this challenge with its new Excel add-in, designed to enable one-click data export from the platform. This feature streamlines reporting workflows, aligns valuations with internal models, and ensures that net asset value (NAV), cap table, dilution, convertible debt, and waterfall scenarios are fully integrated into a single environment.
Why data export matters for private equity and venture capital CFOs
Reporting in illiquid asset classes has become increasingly demanding. LPs expect more transparency, regulators enforce stricter frameworks, and internal teams need faster access to accurate figures.
The growing complexity of reporting requirements
In private equity, growth equity, and venture debt, fund structures involve multiple asset classes, exit scenarios, and evolving portfolio dynamics. CFOs must consolidate information on equity value, NAV, and portfolio company performance, while also tracking the impact of dilution and convertible debt conversions.
Excel remains a trusted environment, but without direct integration, spreadsheets quickly become outdated. Fund managers spend valuable time reconciling numbers, checking formulas, and manually adjusting valuations.
The need for accurate and consistent data
Accuracy is central to valuations. Small discrepancies in waterfall modelling, fully-diluted vs non-fully diluted ownership views, or cap table calculations can lead to significant misrepresentation of NAV. Inconsistent data flows also increase audit risks and weaken confidence in decision-making.
With the ScaleX Excel add-in, data consistency is preserved. CFOs can connect ScaleX datasets directly into Excel models, avoiding re-keying errors and ensuring that all stakeholders work with the same source of truth.
Introducing the ScaleX Excel add-in
The add-in was designed to combine the familiar environment of Excel with the strength of ScaleX’s proprietary models.
One-click export for faster workflows
CFOs and fund controllers can export portfolio details, valuations, and investment metrics in one click. Information such as NAV progression, cap table ownership, dilution impact, and convertible debt positions can be pulled directly into Excel without complex integration steps.

Customisable templates aligned with your models
Every fund has its own reporting standards. Whether preparing LP reports, internal dashboards, or valuation sheets for committees, the add-in lets teams configure templates that match their internal structure. This flexibility ensures adoption across finance, investment, and operations teams without disrupting existing practices.
Automatic refreshes to keep NAV and portfolio data up to date
Valuations and portfolio metrics change quickly. With automated refreshes, the add-in ensures the numbers used in committee presentations or LP reporting are always aligned with the most recent ScaleX datasets. This reduces the risk of presenting outdated figures.
Key benefits for CFOs and fund managers
Beyond efficiency gains, the Excel add-in improves transparency and strengthens governance across reporting processes.
Streamlined LP reporting and audit readiness
LPs expect timely and accurate reports, often in customised formats. With one-click exports, CFOs can deliver NAV and ownership details — including fully-diluted and non-fully diluted positions — directly into investor-ready templates.
Auditors benefit from the same consistency. Instead of reconciling multiple spreadsheet versions, they can rely on the integrity of ScaleX’s valuation models connected through the add-in.
Simplified valuation workflows for committees
Valuation committees often require detailed scenarios, such as waterfall outcomes or the impact of convertible debt. These are now integrated into Excel, enabling CFOs to present dynamic views with updated data. Committees can review dilution hypotheses or NAV distributions without questioning the reliability of inputs.
Consistency in cap table, dilution, convertible debt, and waterfall scenarios
The cap table reflects ownership across share classes and shows the impact of dilution from stock options or convertible debt. These factors directly influence how NAV is calculated and reported.
With the ScaleX Excel add-in, CFOs can track fully-diluted and non-fully diluted positions, model waterfall distributions, and test NAV with or without preferences. Carve-out or IRR-based payout scenarios can also be simulated, ensuring valuations remain accurate and consistent for all stakeholders.
Seamless adoption across teams
Integration challenges often slow down adoption of financial tools. The ScaleX Excel add-in was designed to avoid this.
Keeping workflows intact
Funds already rely on Excel for committee packs, LP reports, and investor updates. By embedding ScaleX directly into this environment, CFOs can continue established workflows while enriching them with live data. This reduces resistance to change and speeds up adoption.
Reducing friction between teams
Collaboration between finance, investment, and operations teams often suffers when figures do not match. With a single source of truth exported from ScaleX, all teams work with the same NAV, cap table ownership, and valuation assumptions. This reduces reconciliation tasks and improves communication.
FAQ
How does the Excel add-in work for fund managers?
The add-in connects directly to ScaleX datasets. In one click, you can export portfolio data, valuations, cap table details, and NAV figures into Excel. Templates let you adapt the export to your reporting standards.
Can I customise the export templates to fit my reporting?
Yes. The add-in supports flexible templates, allowing you to align exports with LP reporting formats, committee dashboards, or valuation packs without rebuilding your processes.
How does this feature help with cap table and dilution management?
Cap table ownership is central to ScaleX models. The add-in ensures exports reflect both fully-diluted and non-fully diluted positions, including the impact of stock options and convertible debt conversions, reducing the risk of inconsistencies.
Conclusion: your data, our models, seamlessly in Excel
The ScaleX Excel add-in bridges the gap between robust valuation models and everyday spreadsheet workflows. CFOs and fund managers can streamline LP reporting, reinforce audit readiness, and ensure consistent NAV analysis, all within their familiar Excel environment.
With one-click exports, customisable templates, and automatic refreshes, ScaleX makes data integration straightforward, helping illiquid asset managers focus on what matters most: decision-making.